Context
Replacement policies make different choices when given the same sequence of accesses. CacheLab was developed to study that difference reproducibly: controlling capacity, repeating the trace, and comparing hits and misses without mixing algorithms with result presentation.
My contribution
I implemented the simulator, all three policies, the command-line interface, and scripts for trace generation, experiments, and reporting. I also organized tests for policies, input data, and outputs to connect algorithm behavior to the resulting metrics.
How it works
- A seeded generator produces synthetic accesses with different frequency and locality levels.
- The simulator validates the CSV and applies the selected policy with a defined cache capacity.
- Each access increments hits or misses; the experiment repeats policy and capacity combinations.
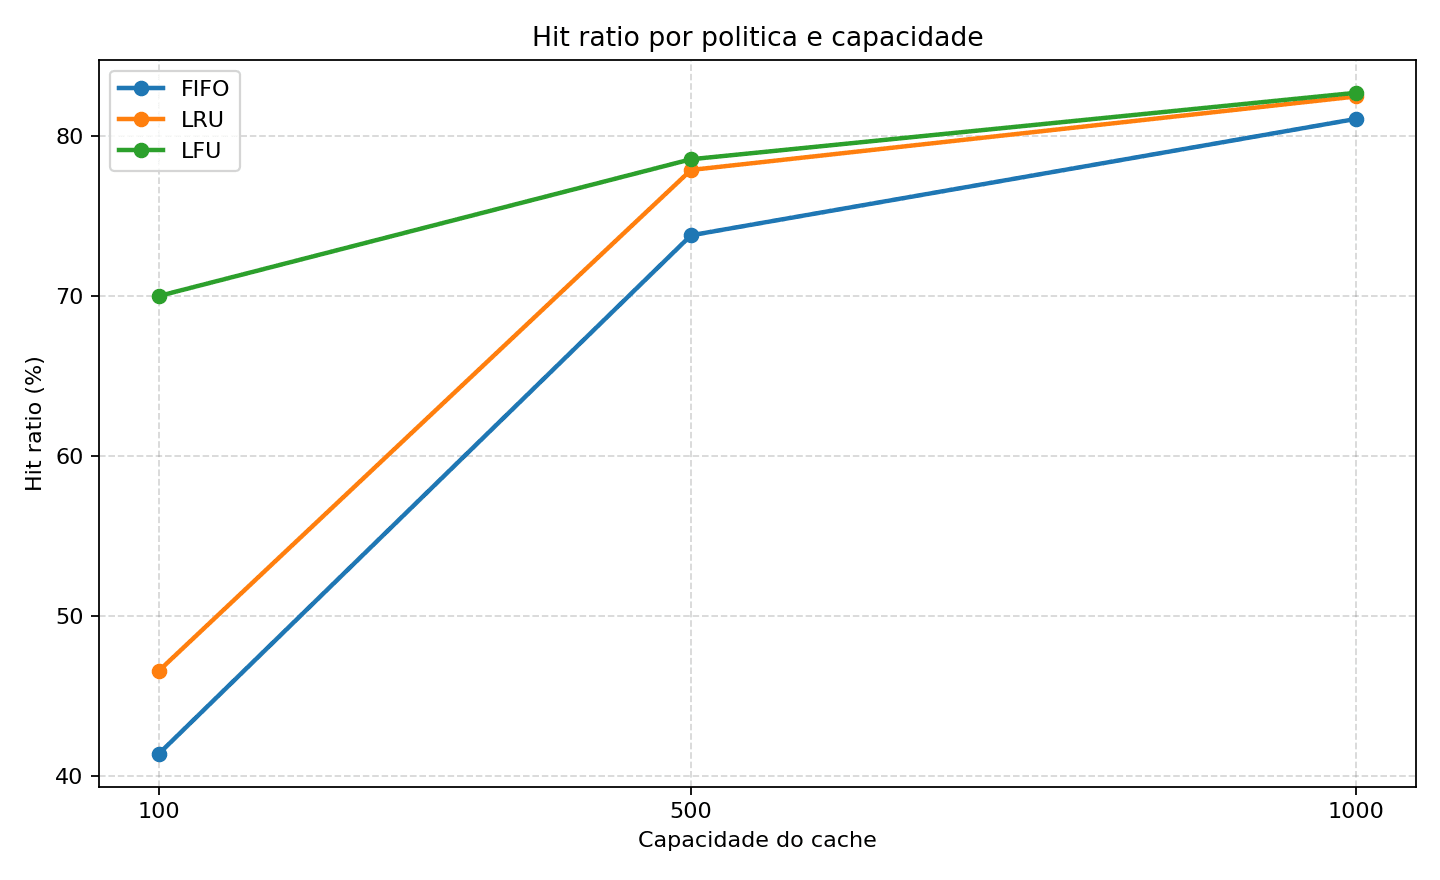
- Results are exported to CSV, compared in a chart, and used to assemble a PDF report.
Technical decisions
Compare using the same input
Separating trace generation from execution allows every policy to receive the same sequence. The seed and parameters make the scenario behind each result explicit.
Define LFU tie-breaking
When two items have the same frequency, the simulator removes the one inserted earlier. Making this explicit in the algorithm and tests avoids comparisons based on accidental behavior.
What I learned
An algorithm comparison needs to explain more than which line ended highest on a chart. The trace and capacity explain the result; varying them helps reveal when a policy favors the observed access pattern.
Limits and next steps
- The study uses synthetic traces and simulates item replacement; it does not measure hardware-cache or production performance.
- The chart represents a saved run, not universal superiority of any policy.